For the following questions use the information in Table 10.1,which shows real GDP and potential real GDP for the years 2001-2010. 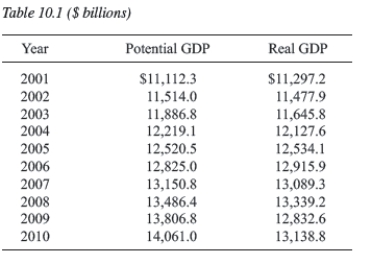
-According to the data in Table 10.1,about how much did short-run output fluctuations equal in 2001 and 2008,respectively?
A) -1.6%,1.1%
B) 1.7%;-1.1%
C) 101.6;147.2
D) -184.9;147.2
E) not enough information
Correct Answer:
Verified
Q22: When the Fed began to raise the
Q22: The acronym "CDO" stands for:
A) constant deficit
Q30: In the middle of 2009 _;by February
Q31: For the following questions use the information
Q33: For the following questions use the information
Q34: For the following questions use the information
Q36: The acronym "TARP" stands for:
A)Total Assistance for
Q37: In a typical recession,the only _ expenditure
Q39: The sharp swing in core inflation in
Q40: Which of the following financial institutions was
Unlock this Answer For Free Now!
View this answer and more for free by performing one of the following actions

Scan the QR code to install the App and get 2 free unlocks

Unlock quizzes for free by uploading documents