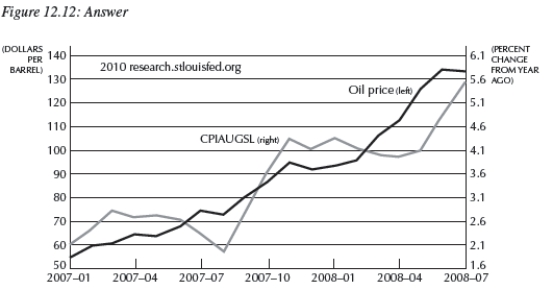
-Consider Figure 12.12 below,which shows the price of oil from January 2007-July 2008.What are the impacts of this on the macroeconomy? In particular which curve does this impact? Explain. 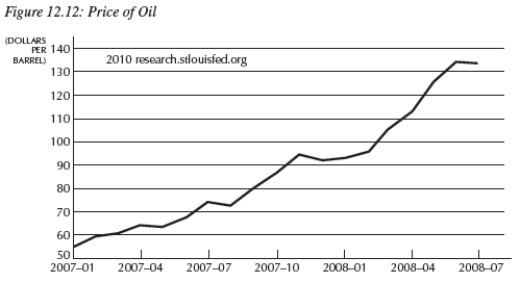
Correct Answer:
Verified
View Answer
Unlock this answer now
Get Access to more Verified Answers free of charge
Q85: One of the explanations for the high
Q86: In the Phillips curve, Q91: In March and April 1980,inflation in the Q103: When the Fed targets the interest rate, Q109: The term structure of interest rates is Q112: When the Fed targets the federal funds Q115: If the price of oil unexpectedly rises, Q122: Figure 12.16: Output Q129: What are the mechanics of lowering interest Q135: Refer to the following figure when answering![]()
![]()
Unlock this Answer For Free Now!
View this answer and more for free by performing one of the following actions

Scan the QR code to install the App and get 2 free unlocks

Unlock quizzes for free by uploading documents