Assume that the number (in millions) of basic cable television subscribers in the United States from 1996 through 2005 is given in the following table.Use a graphing utility to graph a scatter plot of the given data.Describe any trends that appear within the last four years. 
A) 
The number of subscribers appears to be increasing.
B) 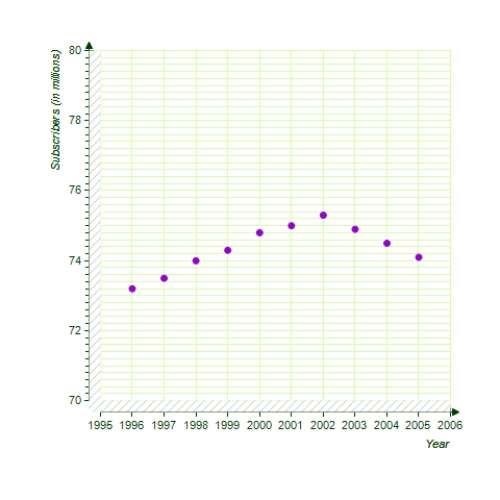
The number of subscribers appears to be decreasing.
C) 
The number of subscribers appears to be linearly decreasing.
D) 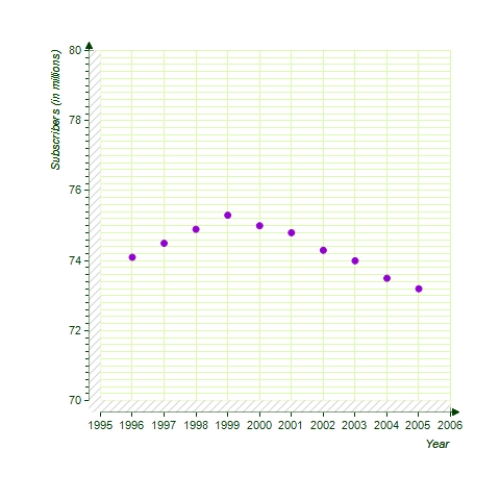
The number of subscribers appears to be decreasing
E) 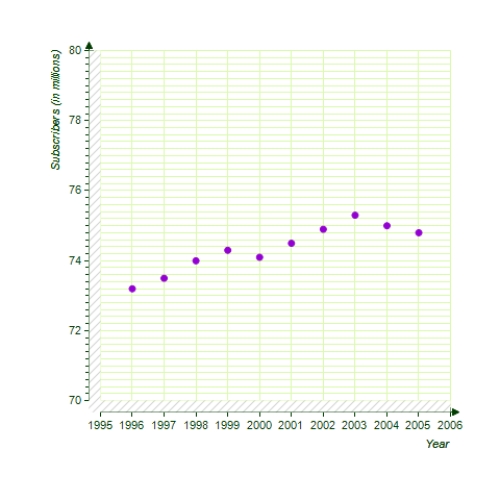
The number of subscribers appears to be linearly increasing.
Correct Answer:
Verified
Q3: Find the x- and y- intercepts of
Q4: Copy the points (-2,5),(3,-5),(-4,-1),(4,0),(2,-3)in the Cartesian plane.
Q5: Sketch the graph of the equation:
Q6: Write the general form of the equation
Q7: Assume that the number (in millions)of cellular
Q9: Find the distance between the points (-2,-5)and
Q10: Sketch the graph of the equation.
Q11: Which of the following is the correct
Q12: Sketch the graph of the function
Q13: Which of the following is the correct
Unlock this Answer For Free Now!
View this answer and more for free by performing one of the following actions

Scan the QR code to install the App and get 2 free unlocks

Unlock quizzes for free by uploading documents