The graph shows the number of visitors V to a national park in hundreds of thousands during a one-year period,where  represents January.Estimate the rate of change of V over the interval
  Round your answer to the nearest hundred thousand visitors per year.
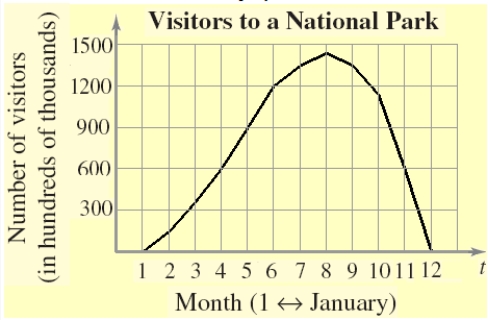
A) 187.5 hundred thousand visitors per year
B) 281.25 hundred thousand visitors per year
C) 225 hundred thousand visitors per year
D) 562.5 hundred thousand visitors per year
E) 1125 hundred thousand visitors per year
Correct Answer:
Verified
Q100: Find the slope of the tangent line
Q101: Find the marginal profit for producing x
Q102: Find the derivative of the function.
Q103: Find an equation of the line that
Q104: Find an equation of the line that
Q106: Differentiate the given function.

Q107: Find the derivative of the function
Q108: Differentiate the given function.
Q109: Find the marginal revenue for producing x
Q110: Find the derivative of the following function
Unlock this Answer For Free Now!
View this answer and more for free by performing one of the following actions

Scan the QR code to install the App and get 2 free unlocks

Unlock quizzes for free by uploading documents