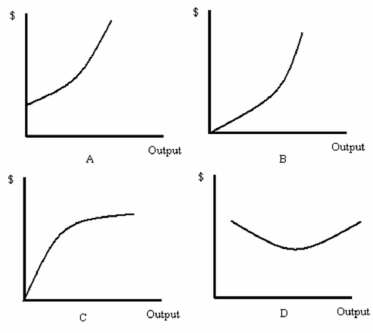
-Refer to Figure 8.1.Which graph best represents a variable cost function?
A) A
B) B
C) C
D) D
Correct Answer:
Verified
Q1: Q4: The slope of an isocost line is Q5: If the least-cost input combination doesn't include Q6: Suppose a firm's total cost of production Q7: Suppose the marginal rate of technical substitution Q8: A firm's _ connects all the input Q9: If Q represents a firm's level of Q11: The cost associated with foregoing the opportunity Q14: Suppose a firm's short-run production function is Q15: Suppose a firm's short-run production function is![]()
Unlock this Answer For Free Now!
View this answer and more for free by performing one of the following actions

Scan the QR code to install the App and get 2 free unlocks

Unlock quizzes for free by uploading documents