Multiple Choice
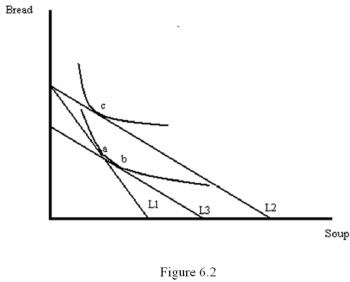
-Figure 6.2 illustrates a change in the price of soup.From the graph,we can conclude that
A) The price of soup has increased and soup is a Giffen good
B) The price of soup has fallen and soup is a Giffen good
C) The price of soup has fallen and soup is a normal good
D) The price of soup has fallen and bread is a Giffen good
Correct Answer:
Verified
Related Questions
Q7: What effect does a compensated price change
Q8: A compensated increase in the price of
Q9: Q10: If a good is normal,then the income Q10: Which of the following does NOT occur![]()

