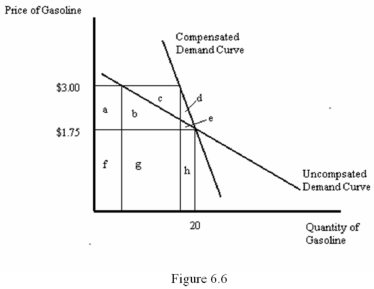
-Refer to Figure 6.6.What area represents the compensation for an increase in the price of gasoline from $1.75 to $3.00 per gallon?
A) a + b + c + d + e
B) f + g + h
C) a + b + c
D) d + e
Correct Answer:
Verified
Q43: A demand curve that shows the relationship
Q44: Q45: The demand curve for leisure will slope Q46: Q47: A demand curve that shows the relationship Q49: Suppose that an individual has chosen not Q51: Using a graph,explain both the substitution effect Q52: Because individuals initially own more time than Q53: Which of the following best describes labour Q60: What is the difference between approximate and![]()
![]()
Unlock this Answer For Free Now!
View this answer and more for free by performing one of the following actions

Scan the QR code to install the App and get 2 free unlocks

Unlock quizzes for free by uploading documents