Multiple Choice
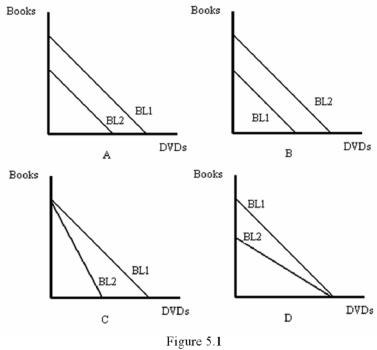
-Refer to Figure 5.1.Which graph represents an increase in the price of DVDs?
A) A
B) B
C) C
D) D
Correct Answer:
Verified
Related Questions
Q12: Suppose a consumer buy books and DVDs.The
Q15: Suppose a consumer purchases pizza and soft
Q16: Q18: A consumer's budget constraint is Q19: An increase in the price of the![]()
A) A positively

