Multiple Choice
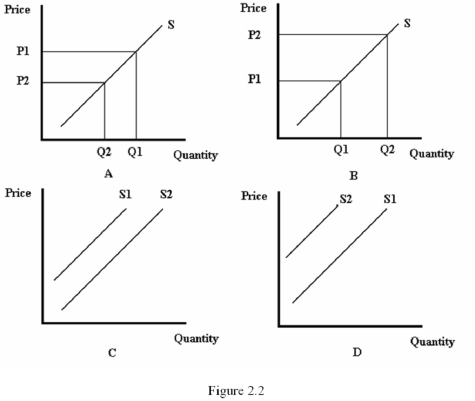
-Refer to Figure 2.2.Which diagram represents the effect of a lower gasoline price on the supply of gasoline?
A) A
B) B
C) C
D) D
Correct Answer:
Verified
Related Questions
Q16: If an increase in the price of
Q17: Suppose the demand function for cable TV
Q18: An increase in the price of a
Q19: An increase in the price of a
Q20: If an increase in the price of
Unlock this Answer For Free Now!
View this answer and more for free by performing one of the following actions

Scan the QR code to install the App and get 2 free unlocks

Unlock quizzes for free by uploading documents