Multiple Choice
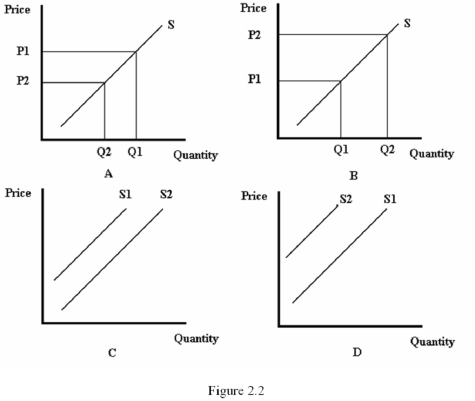
-Refer to Figure 2.2.Which diagram best represents the effect of lower fertilizer prices on the market for corn?
A) A
B) B
C) C
D) D
Correct Answer:
Verified
Related Questions
Q24: Which economist is credited with originating the
Q25: Which economist won the Nobel Prize for
Q34: Which of the following best describes the
Q36: Supply curves tend to be _ in
Q40: The _ the demand curve,the _ responsive
Q41: Suppose that when the price of hot
Q42: For a linear demand curve,demand is _
Unlock this Answer For Free Now!
View this answer and more for free by performing one of the following actions

Scan the QR code to install the App and get 2 free unlocks

Unlock quizzes for free by uploading documents