Narrbegin Exhibit 3.2 Demand curves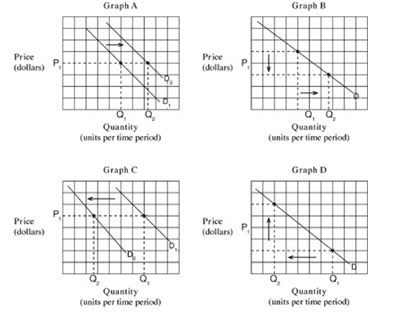
-Which of the graphs in Exhibit 3.2 depicts the effect of an increase in income on the demand for luxury cars?
A) Graph A.
B) Graph B.
C) Graph C.
D) Graph D.
Correct Answer:
Verified
Q1: Narrbegin Exhibit 3.1 Market demand 
Q3: Narrbegin Exhibit 3.2 Demand curves Q4: Which of the following pairs is the Q4: A demand curve for The Steel Porcupines' Q5: Assume that croutons and soup are complementary Q6: Other things being equal, the effect of Q9: A demand curve: Q10: Demand for goods and services reflects: Q11: According to the law of demand: Q136: Assuming that hamburgers and hot dogs are![]()
A) has a positive slope.
B)
A) the
A) as
Unlock this Answer For Free Now!
View this answer and more for free by performing one of the following actions

Scan the QR code to install the App and get 2 free unlocks

Unlock quizzes for free by uploading documents