Narrbegin Exhibit 3.3 Supply curves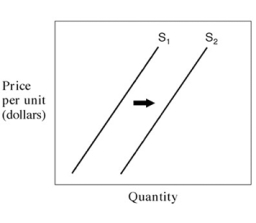
-In Exhibit 3.3, a shift in the supply curve from S1 to S2 represents a/an:
A) decrease in supply.
B) decrease in the quantity supplied.
C) increase in supply.
D) increase in the quantity supplied.
E) increase in demand.
Correct Answer:
Verified
Q48: Which of the following will cause a
Q49: Which of the following will cause a
Q51: Narrbegin Exhibit 3.3 Supply curves Q52: The law of supply states that everything Q54: What happens when a cyclone destroys the Q55: Supply is: Q56: The law of supply states that everything Q57: The supply curve reflects the: Q58: Supply is a relationship between: Q66: A supply schedule shows the relationship between:![]()
A) the number of units available.
B)
A) inverse relationship
A) price of
A)
Unlock this Answer For Free Now!
View this answer and more for free by performing one of the following actions

Scan the QR code to install the App and get 2 free unlocks

Unlock quizzes for free by uploading documents