Narrbegin Exhibit 6.9 Cost curves 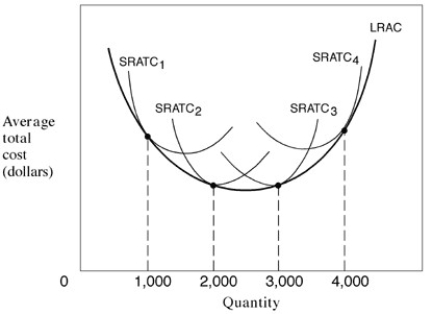
-In Exhibit 6.9, the U-shaped LRAC curve indicates which of the following as quantity increases from 0 to 4000?
A) Diseconomies of scale; constant returns to scale; economies of scale.
B) Constant returns to scale; economies of scale; diseconomies of scale.
C) Economies of scale; constant returns to scale; diseconomies of scale.
D) Diseconomies of scale; economies of scale; constant returns to scale.
Correct Answer:
Verified
Q92: If MC is greater than ATC, we
Q93: If the wage rate is constant:
A) the
Q94: Narrbegin Exhibit 6.9 Cost curves 
Q96: The marginal cost:
A) always rises in the
Q98: For a typical firm, the long-run average
Q99: Narrbegin Exhibit 6.9 Cost curves
Q100: The law of diminishing returns explains why:
A)
Q111: When the curve that envelops the series
Q203: Suppose a firm earns an accounting profit.
Q235: In the long run, all costs are
Unlock this Answer For Free Now!
View this answer and more for free by performing one of the following actions

Scan the QR code to install the App and get 2 free unlocks

Unlock quizzes for free by uploading documents