The population  (in millions of people) of North America from 1980 to 2050 can be modeled by
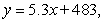
 where
where  represents the year, with
  corresponding to 2050.Find the y-intercept of the graph of the model.What does it represent in the given situation?
A)  It represents the population (in millions of people) of North America in 2050.
B)  It represents the population (in millions of people) of North America in 1990.
C)  It represents the population (in millions of people) of North America in 2030.
D)  It represents the population (in millions of people) of North America in 2020.
E)  It represents the population (in millions of people) of North America in 1980.
Correct Answer:
Verified
Q7: Find the x- and y-intercepts of the
Q8: Plot the points below whose coordinates are
Q9: Find an equation of a circle that
Q10: Graph the following equation by plotting points
Q11: Sketch the graph of the equation below.
Q13: Find the x- and y-intercepts of the
Q14: Write the standard form of the equation
Q15: Find the slope of the line that
Unlock this Answer For Free Now!
View this answer and more for free by performing one of the following actions

Scan the QR code to install the App and get 2 free unlocks

Unlock quizzes for free by uploading documents