The federal debt of the United States as a percentage of the Gross Domestic Product (GDP) from 2001 to 2005 is shown in the table.In the table,  represents the year, with
  corresponding to 2002.
 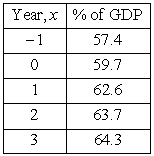 Find the least squares regression parabola
 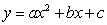 for the data by solving the following system.
 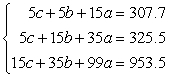 Use the model to predict the federal debt as percents of GDP in 2010.Round to the nearest tenth percents.
A) 64.2%
B) 52.7%
C) 56.5%
D) 61.9%
E) 48.2%
Correct Answer:
Verified
Q47: Solve the system of equations below:
Q48: A real estate company borrows $2,000,000.Some of
Q49: A mixture of 5 gallons of chemical
Q50: Use a graphing utility to graph the
Q51: Graph the solution set of the system
Q53: Find an equation of the form
Q54: Write an inequality for the shaded region
Q55: A residential building contractor borrowed $31,000 to
Q56: Sketch the graph of the inequality below.
Q57: Find the equation of the circle
Unlock this Answer For Free Now!
View this answer and more for free by performing one of the following actions

Scan the QR code to install the App and get 2 free unlocks

Unlock quizzes for free by uploading documents