The following graphic of cigarettes smoked (sold) per capita (CIG) and deaths per 100K population from lung cancer (LUNG) indicates _________ 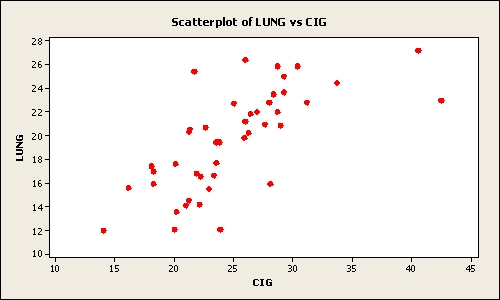
A) a weak relation between the two variables
B) a pretty strong relation between the two variables
C) when the number of cigarettes smoked (sold) per capita (CIG) increases the deaths per 100K population from lung cancer (LUNG) decreases
D) a negative relation between the two variables
E) no relation between the two variables
Correct Answer:
Verified
Q57: Each day,the office staff at Oasis Quick
Q58: The following represent the ages of students
Q59: The staff of Mr.Wayne Wertz,VP of Operations
Q60: Consider the following stem and leaf plot:
Q61: According to the following graphic,"Bent Pins" account
Q63: Suppose a market survey of 200 consumers
Q64: Suppose a market survey of 200 consumers
Q65: The staff of Ms.Tamara Hill,VP of Technical
Q66: A recent survey of U.S.automobile owners showed
Q67: The staffs of the accounting and the
Unlock this Answer For Free Now!
View this answer and more for free by performing one of the following actions

Scan the QR code to install the App and get 2 free unlocks

Unlock quizzes for free by uploading documents