According to the following graphic,X and Y have _________. 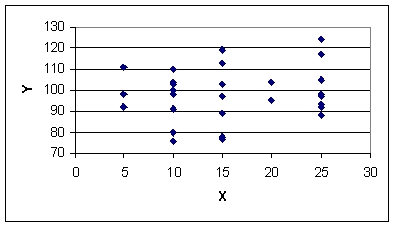
A) strong negative correlation
B) virtually no correlation
C) strong positive correlation
D) moderate negative correlation
E) weak negative correlation
Correct Answer:
Verified
Q22: Regression output from Excel software directly shows
Q26: From the following scatter plot,we can say
Q28: A t-test is used to determine whether
Q29: From the following scatter plot,we can say
Q33: From the following scatter plot,we can say
Q35: According to the following graphic,X and Y
Q36: Regression output from Minitab software directly displays
Q37: The numerical value of the coefficient of
Q39: Regression output from Minitab software includes an
Q40: The variability in the estimated slope is
Unlock this Answer For Free Now!
View this answer and more for free by performing one of the following actions

Scan the QR code to install the App and get 2 free unlocks

Unlock quizzes for free by uploading documents