Figure 2-3
Tonnes
of
Soybeans 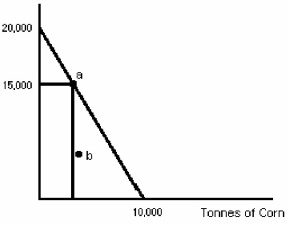
-A farmer has 100 hectares of land on which he can grow either soybeans or corn.A hectare of land yields 200 tonnes of soybeans or 100 tonnes of corn.Figure 2-3 shows the farmer's
A) trade-off curve.
B) opportunity cost curve.
C) substitution options curve.
D) production possibilities curve.
Correct Answer:
Verified
Q25: Which of the following would cause an
Q26: Figure 2-3 Q27: Figure 2-2 Q28: Figure 2-2 Q29: Figure 2-3 Q31: A society on its production possibilities curve Q32: Production is efficient if Q33: If an economy is operating at a Q34: A point outside a society's PPC is Q35: Figure 2-2 Unlock this Answer For Free Now! View this answer and more for free by performing one of the following actions Scan the QR code to install the App and get 2 free unlocks Unlock quizzes for free by uploading documents
Tonnes
of
Soybeans ![]()
![]()
![]()
Tonnes
of
Soybeans ![]()
A)it generates a point
A)technologically![]()

