Multiple Choice
Figure 2-3
Tonnes
of
Soybeans 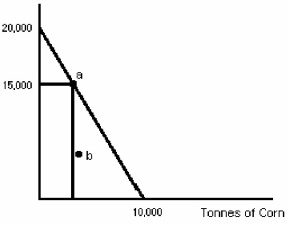
-The production possibilities curve shown in Figure 2-3 shows that the opportunity cost of each tonne of soybeans is
A) 1 tonne of corn.
B) 1/2 tonne of corn.
C) 2/3 tonnes of corn.
D) 2 tonnes of corn.
Correct Answer:
Verified
Related Questions
Q16: One assumption underlying the production possibilities curve
Q17: Figure 2-2 Q18: Figure 2-2 Q19: Figure 2-2 Q20: A society currently operating on its production Q22: A movement along the production possibilities curve Q23: The prime minister of Canada promises to Unlock this Answer For Free Now! View this answer and more for free by performing one of the following actions Scan the QR code to install the App and get 2 free unlocks Unlock quizzes for free by uploading documents![]()
![]()
![]()

