Figure 6-1 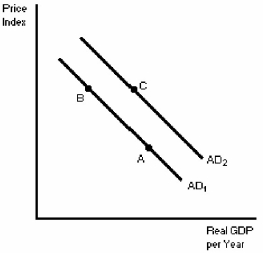
-In Figure 6-1,a movement from point C to point B could be explained by
A) an increase in the price level.
B) a decrease in the price level.
C) the end of a short-term war.
D) the real-balance effect.
Correct Answer:
Verified
Q20: The long-run aggregate supply curve
A)is horizontal.
B)indicates the
Q21: If you have $1 000 and the
Q22: According to the interest rate effect,an increase
Q23: An increase in the price level
A)increases the
Q24: Figure 6-1 Q26: A rise in the price level will Q28: The aggregate demand curve usually Q29: The horizontal axis for an aggregate demand Q30: Figure 6-1 Q139: If you have $5000 and the GDP![]()
A)is vertical.
B)slopes upward.
C)slopes![]()
Unlock this Answer For Free Now!
View this answer and more for free by performing one of the following actions

Scan the QR code to install the App and get 2 free unlocks

Unlock quizzes for free by uploading documents