Refer to Infographic 1.What does the figure show? 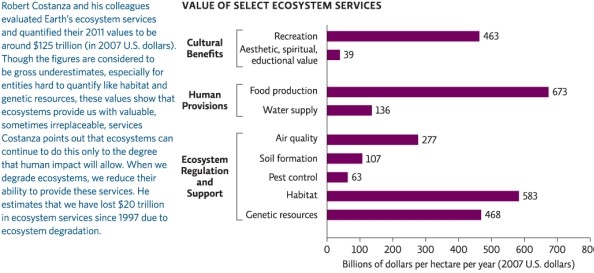
A) the cost to restore a degraded ecosystem for particular ecosystem services
B) the price of maintaining ecosystems such that they can continue to provide specific ecosystem services without degrading the environment
C) the monetary value ascribed to particular ecosystem services
D) the ecological footprint value of specific ecosystem services
E) the cost differential between natural capital and natural interest
Correct Answer:
Verified
Q12: Which of the following is NOT an
Q13: Refer to Infographic 1.Which ecosystem service is
Q14: A(n)_ for a country is the amount
Q15: The government must decide if a section
Q16: Which of the following would NOT be
Q18: What is meant by the term "sustainable"?
A)capable
Q19: While placing a monetary value on ecosystem
Q20: Why is the production of some ecosystem
Q21: Including both internal and external costs when
Q22: The IPAT equation is used to estimate
Unlock this Answer For Free Now!
View this answer and more for free by performing one of the following actions

Scan the QR code to install the App and get 2 free unlocks

Unlock quizzes for free by uploading documents