Refer to the graph depicting ocean acidification over time in Infographic 1.Which of the following statements is TRUE of the graph? 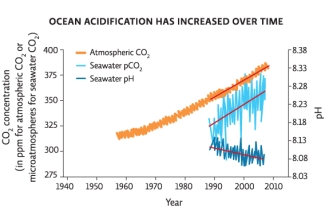
A) As the atmospheric concentration of CO2 increases,the amount of CO2 absorbed by the oceans (pCO2) also increases.
B) As the atmospheric concentration of CO2 increases,the amount of CO2 absorbed by the oceans (pCO2) decreases.
C) As the atmospheric concentration of CO2 increases,the seawater pH increases.
D) As the amount of CO2 absorbed by the oceans (pCO2) decreases,the seawater pH increases.
E) None of these answers is correct.
Correct Answer:
Verified
Q4: What is the major cause of ocean
Q5: Nutrient-rich areas where shallow rivers meet the
Q6: Organisms use calcium and carbonate to make
Q7: What do organisms use to make shells?
A)Ca+2
B)H2O
C)H+
D)CO2
E)CaCO3
Q8: What is ocean acidification? How are humans
Q10: What allows CO2 to mix quickly into
Q11: A pH drop of 0.1 corresponds to
Q12: What is the pH trend in the
Q13: Scientists estimate _ of all CO2 released
Q14: When a solution becomes acidic,it contains a
Unlock this Answer For Free Now!
View this answer and more for free by performing one of the following actions

Scan the QR code to install the App and get 2 free unlocks

Unlock quizzes for free by uploading documents