Science Literacy Refer to the graphs below to answer the following questions. Below are data from a study (described in Module 6.3) conducted by Michael Lesser,Marc Slattery,and colleagues.The rate of photosynthesis (Graph A) and the amount of carbohydrate present (Graph B) ,an indication of photosynthetic production of sugars,were determined in sponges exposed to current temperature and pH (control) or to one of three test groups: the expected pH in 2100 (test group 1) ,the expected temperature in 2100 (test group 2) ,or both (test group 3) . (Note: Significant difference between groups is denoted by a different letter above the bars; if two groups share the same letter,they are not statistically different.) 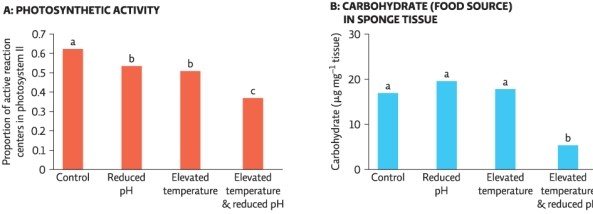
-What was the dependent variable(s) for the rate of photosynthesis experiment?
A) reduced pH
B) elevated temperature
C) elevated pH
D) both reduced pH and elevated temperature
Correct Answer:
Verified
Q66: Refer to Infographic 7.Describe ways that you
Q67: Which of the following statements is/are TRUE
Q68: Match each term in the left-hand column
Q69: Science Literacy Refer to the graphs below
Q70: A young woman asks what the danger
Q71: What are MPAs?
A)fishing areas for commercial fishermen
B)places
Q72: An older man asks you,"What are the
Q74: Science Literacy Refer to the graphs below
Q75: At a Save Our Reefs meeting,people are
Q76: Science Literacy Refer to the graphs below
Unlock this Answer For Free Now!
View this answer and more for free by performing one of the following actions

Scan the QR code to install the App and get 2 free unlocks

Unlock quizzes for free by uploading documents