Infographic 2 tells us that eating one red meat serving per day ___________ compared with those who ate no red meat. 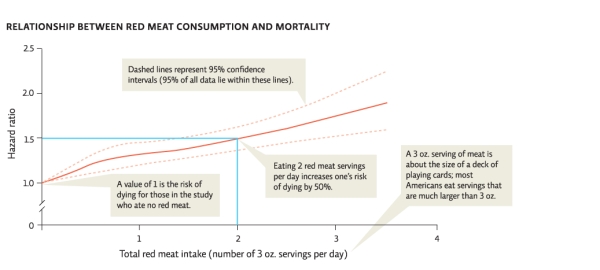
A) increases the risk of dying by 50%
B) has no effect on the risk of dying
C) decreases the risk of dying by about 25%
D) increases the risk of dying by about 25%
E) increases the risk of dying by about 1.25%
Correct Answer:
Verified
Q1: Which of the following is LEAST efficient
Q3: _ affects diet by increasing the demand
Q4: According to Infographic 2,what is the relationship
Q5: Refer to Infographic 2.Explain the relationship between
Q6: According to researchers at the Harvard School
Q7: Overconsumption of meat has been associated with
Q8: According to Infographic 2,in 2005 China's annual
Q9: The _ refers to the amount of
Q10: According to the graph below,the incidence of
E.coli
Q11: According to Infographic 2,a country with a
Unlock this Answer For Free Now!
View this answer and more for free by performing one of the following actions

Scan the QR code to install the App and get 2 free unlocks

Unlock quizzes for free by uploading documents