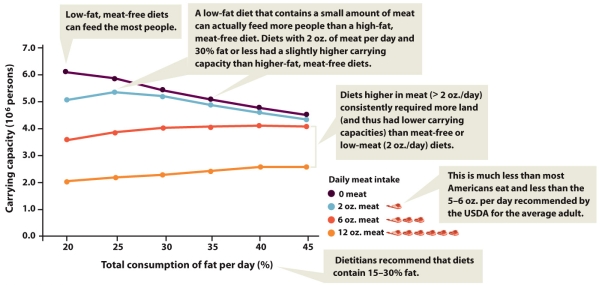
Referring to the graph below,explain how the number of people an area of land can support varies with the meat content of their diet.What happens to that relationship when the total consumption of fat per day increases to 35% or more?
Correct Answer:
Verified
View Answer
Unlock this answer now
Get Access to more Verified Answers free of charge
Q67: You tell Mike about the feed conversion
Q68: Science Literacy Use Infographic 5 below to
Q69: "Eating lower on the food chain" means
Q70: If U.S.agricultural policy changes and CAFOs give
Q71: In terms of how much energy input
Q73: Your friend refers to herself as a
Q74: Science Literacy Use Infographic 5 below to
Q75: What does it mean to "eat lower
Q76: Science Literacy Use Infographic 5 below to
Q77: What could you tell Mike about the
Unlock this Answer For Free Now!
View this answer and more for free by performing one of the following actions

Scan the QR code to install the App and get 2 free unlocks

Unlock quizzes for free by uploading documents