Science Literacy Use the following graph to answer the next questions. 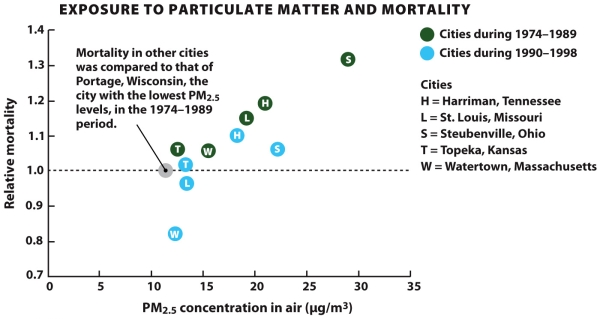
-The city with the lowest particulate matter concentration in the air during 1990-1998 was ____________.
A) St.Louis,Missouri
B) Topeka,Kansas
C) Watertown,Massachusetts
D) Harriman,Tennessee
Correct Answer:
Verified
Q59: Because of the economic costs,there is often
Q60: Paints can release _ while drying,and one
Q61: If a car company wanted to reduce
Q62: You are talking with your family about
Q63: Science Literacy Use the following graph to
Q65: Which form of air pollution would aggravate
Q66: Match each term in the left-hand column
Q67: Particles smaller than _ µg are the
Q68: Particulates can damage respiratory tissue more in
Q69: Science Literacy Use the following graph to
Unlock this Answer For Free Now!
View this answer and more for free by performing one of the following actions

Scan the QR code to install the App and get 2 free unlocks

Unlock quizzes for free by uploading documents