In the graph below,the area between the lines AC and OB after point 'E' represents ________. 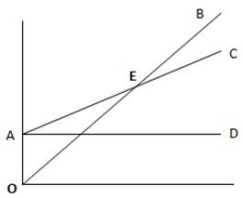
A) fixed costs
B) breakeven point
C) operating loss
D) operating income
Correct Answer:
Verified
Q77: Cost-volume-profit (CVP)analysis assumes that the selling price
Q79: Caty Couture sells designer shirts for $43
Q87: Eric was a professional classical guitar player
Q88: Adam was a professional classical guitar player
Q99: Aspen Manufacturers produces flooring material.The monthly fixed
Q100: Schmidt Company sells glass vases at a
Q108: The breakeven point is the point where
Q109: Sensitivity analysis empowers managers with better information
Q142: Higher fixed costs decrease the total contribution
Q154: Higher fixed costs increase the total number
Unlock this Answer For Free Now!
View this answer and more for free by performing one of the following actions

Scan the QR code to install the App and get 2 free unlocks

Unlock quizzes for free by uploading documents