Multiple Choice
Exhibit 2-9 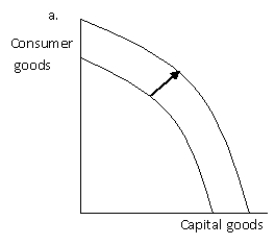
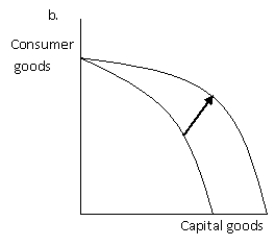
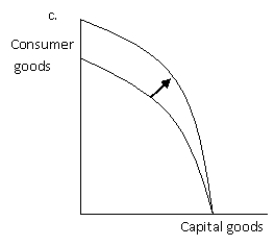
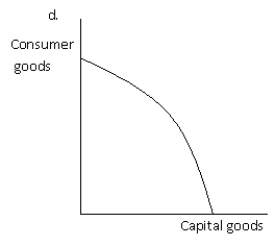
-Refer to Exhibit 2-9. Which of the graphs best illustrates the impact on the production possibilities frontier of a technological improvement that will make the resources used to produce consumer goods more efficient?
A) a
B) b
C) c
D) d
E) b and c
Correct Answer:
Verified
Related Questions

