Multiple Choice
Exhibit 11-4 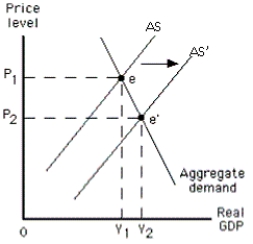
-The graph in Exhibit 11-4 shows a(n)
A) increase in short-run aggregate supply
B) increase in long-run aggregate supply
C) decrease in short-run aggregate supply
D) decrease in long-run aggregate supply
E) decrease in aggregate quantity demanded
Correct Answer:
Verified
Related Questions
Q66: Suppose that the actual and expected price
Q76: As actual output rises above the potential
Q98: As an expansionary gap is closed in
Q98: Exhibit 11-2 Q102: Exhibit 11-4 Q104: Suppose firms are continually surprised by higher-than-expected Unlock this Answer For Free Now! View this answer and more for free by performing one of the following actions Scan the QR code to install the App and get 2 free unlocks Unlock quizzes for free by uploading documents![]()
![]()

