Exhibit 11-9 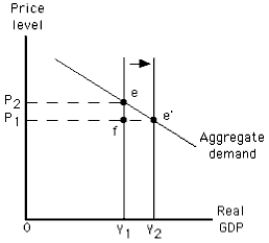
-The graph in Exhibit 11-9 shows a(n)
A) increase in short-run aggregate supply
B) increase in long-run aggregate supply
C) decrease in short-run aggregate supply
D) decrease in long-run aggregate supply
E) decrease in aggregate quantity demanded
Correct Answer:
Verified
Q111: Given the aggregate demand curve,an increase in
Q159: Actual output falls below potential output
A)during a
Q166: Given the aggregate demand curve,a beneficial supply
Q167: The potential level of output can be
Q168: Which of the following is true of
Q170: Which of the following would cause the
Q177: Which of the following would shift the
Q184: Floods in the Midwest that diminish farm
Q189: Given the aggregate demand curve,an adverse supply
Q198: Which of the following would cause the
Unlock this Answer For Free Now!
View this answer and more for free by performing one of the following actions

Scan the QR code to install the App and get 2 free unlocks

Unlock quizzes for free by uploading documents