The following figure shows the production possibilities frontier for Good A and Good B. In the figure below, point f represents:
Figure 2.2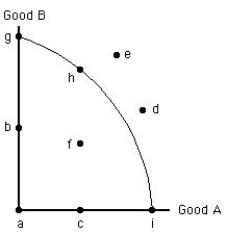
A) an efficient combination of Good A and Good B.
B) the only efficient combination of Good A and Good B.
C) the combination of Good A and Good B that the economy will produce.
D) an inefficient combination of Good A and Good B.
E) the only inefficient combination of Good A and Good B.
Correct Answer:
Verified
Q49: The specialization of labor:
A)increases productivity without creating
Q51: The division of labor increases productivity because:
A)tasks
Q68: Points inside the production possibilities frontier represent:
A)full
Q82: As resources are not perfectly adaptable to
Q101: The figure below shows the production possibilities
Q101: If all resources are used efficiently to
Q104: The figure below shows the production possibilities
Q105: The following figure shows the production possibilities
Q106: The figure given below shows the production
Q122: Points outside the production possibilities frontier represent
A)unemployment
Unlock this Answer For Free Now!
View this answer and more for free by performing one of the following actions

Scan the QR code to install the App and get 2 free unlocks

Unlock quizzes for free by uploading documents