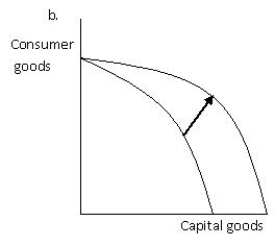
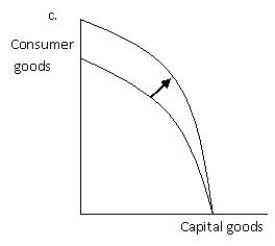
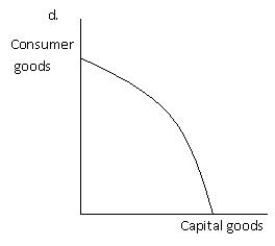
The following figure has four graphs showing the production possibilities frontier for capital goods and consumer goods. Which of the graphs below best illustrates the impact on the production possibilities frontier of a technological improvement that will make the resources used to produce consumer goods more efficient?
Figure 2.5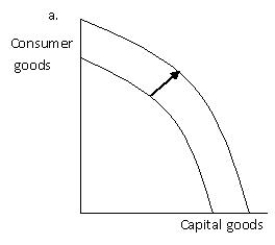
A) a.
B) b.
C) c.
D) d.
E) b and d.
Correct Answer:
Verified
Q97: Which of the following would not shift
Q98: The law of increasing opportunity cost reflects
Q113: A production possibilities frontier can shift outward
Q117: An improvement in technology used to produce
Q121: On a straight-line production possibilities frontier, which
Q125: The figure given below shows the production
Q126: The figure given below shows the production
Q139: A production possibilities frontier can shift inward
Q144: An improvement in technology
A)will always result in
Q149: The production possibilities frontier will shift if
Unlock this Answer For Free Now!
View this answer and more for free by performing one of the following actions

Scan the QR code to install the App and get 2 free unlocks

Unlock quizzes for free by uploading documents