Figure 4.2 shows the demand curves for a good. A shift from demand curve D' to demand curve D in the figure below would be caused by a(n) :
Figure 4.2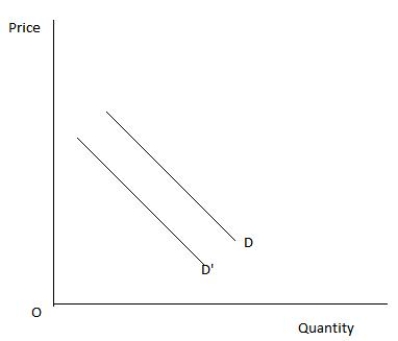
A) increase in the price of the good under consideration.
B) significant decrease in population because of emigration.
C) increase in the price of a substitute good.
D) decrease in the number of producers of the product.
E) decrease in the price of an important resource.
Correct Answer:
Verified
Q30: In case of a normal good,an increase
Q32: If the price of vanilla ice cream
Q33: If Good B is a complement to
Q34: If demand for personal computers increases as
Q41: A change in money income of consumers
Q47: As the price of milk increases,producers are
Q49: A supply curve typically slopes upward because:
A)opportunity
Q63: Figure 4.4 shows the supply curve for
Q65: In the figure given below that shows
Q66: Figure 4.2 shows the demand curves for
Unlock this Answer For Free Now!
View this answer and more for free by performing one of the following actions

Scan the QR code to install the App and get 2 free unlocks

Unlock quizzes for free by uploading documents