The table given below shows the quantity supplied and the quantity demanded for a good at different prices. If the market price of the good is $1.20, there will be a _____.
Table 4.1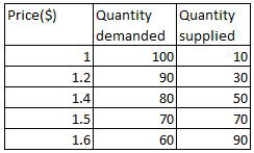
A) shortage of 30 units
B) surplus of 30 units
C) shortage of 60 units
D) surplus of 60 units
E) surplus of 20 units
Correct Answer:
Verified
Q44: Which of the following would most likely
Q59: As the baby boom ended,fewer families had
Q62: Which of the following will indicate a
Q63: Which of the following is likely to
Q68: Which of these is likely to decrease
Q76: Which of the following is likely to
Q77: Figure 4.3 shows the supply curves for
Q78: Figure 4.3 shows the supply curves for
Q80: A shortage of textbooks is most likely
Q129: Recently it has been discovered that lobsters
Unlock this Answer For Free Now!
View this answer and more for free by performing one of the following actions

Scan the QR code to install the App and get 2 free unlocks

Unlock quizzes for free by uploading documents