Table 5.5 shows the quantity supplied and the quantity demanded for restaurant meals at different prices. Use the information in the table below to calculate the price elasticity of supply for restaurant meals. Table 5.5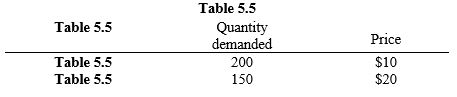
A) 7
B) 2
C) 1/2
D) 3/5
E) 5/3
Correct Answer:
Verified
Q98: Figure 5.6 shows a vertical demand curve.
Q99: If a firm facing a perfectly elastic
Q100: Given the availability of California oranges, the
Q105: Luis wonders why commercials appear more frequently
Q112: Given the proportion of a consumer's income
Q115: Which of the following is a possible
Q123: As DVDs become popular substitutes for video
Q123: If an increase in price from $1.20
Q128: If people have more time to adjust
Q152: The demand for flour is
A)inelastic because there
Unlock this Answer For Free Now!
View this answer and more for free by performing one of the following actions

Scan the QR code to install the App and get 2 free unlocks

Unlock quizzes for free by uploading documents