Figure 5.8 shows a horizontal line. The curve shown in the figure below could represent a: Figure 5.8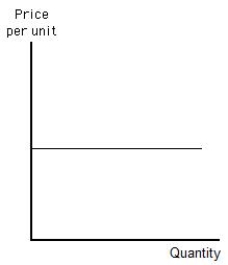
A) perfectly elastic demand or supply curve.
B) perfectly inelastic supply curve or a perfectly elastic demand curve.
C) perfectly elastic supply curve or a perfectly inelastic demand curve.
D) perfectly inelastic supply or demand curve.
E) perfectly inelastic supply curve or a demand that is unit elastic.
Correct Answer:
Verified
Q109: A common determinant of both the price
Q114: A good that takes up a very
Q114: If price increases from $45 to $55,
Q115: Which of the following goods will have
Q122: If an increase in price from $1
Q123: If an increase in price from $1.20
Q143: The supply curve for dorm rooms on
Q146: One determinant of the price elasticity of
Q150: If supply is perfectly elastic,the supply curve
Q152: The supply of paintings by Van Gogh
Unlock this Answer For Free Now!
View this answer and more for free by performing one of the following actions

Scan the QR code to install the App and get 2 free unlocks

Unlock quizzes for free by uploading documents