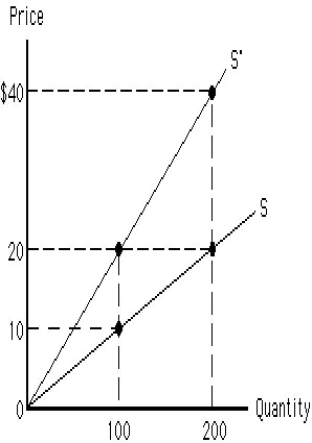
Figure 5.10 shows two upward-sloping linear supply curves that pass through the origin. The price elasticity of supply between $10 and $20 on the supply curve S is _____. Figure 5.10
A) 0
B) infinity
C) 1
D) 2
E) 10
Correct Answer:
Verified
Q131: Figure 5.10 shows two upward-sloping linear supply
Q133: In order to prove that macaroni is
Q138: Income elasticity of demand is greater than
Q139: Table 5.6 shows the change in the
Q140: For which of the following goods is
Q142: Inferior goods have an income elasticity of
Q160: Goods with an income elasticity of demand
Q166: A 5 percent increase in income leads
Q168: The cross-price elasticity of demand measures the
Q183: Demand for a necessity, such as food,
Unlock this Answer For Free Now!
View this answer and more for free by performing one of the following actions

Scan the QR code to install the App and get 2 free unlocks

Unlock quizzes for free by uploading documents