Figure 5.10 shows two upward-sloping linear supply curves that pass through the origin. Which supply curve is more elastic in the figure below? Figure 5.10
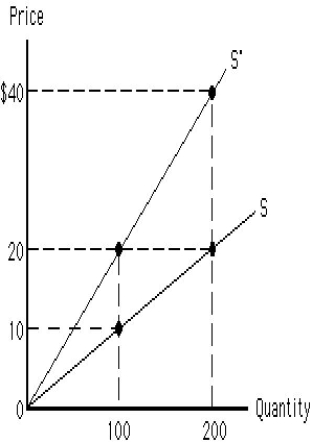
A) Both S and S' have the same elasticity.
B) S is more elastic at lower prices, and S' is more elastic at higher prices.
C) S is more elastic at higher prices, and S' is more elastic at lower prices.
D) S is more elastic than S'.
E) S' is more elastic than S.
Correct Answer:
Verified
Q118: Figure 5.7 shows four demand curves. The
Q120: All other things constant, if a _
Q128: Figure 5.9 shows three upward-sloping linear supply
Q149: An inferior good is _
A)any good of
Q151: The supply of a product will be
Q155: As the economy recovers from a recession,we
Q164: Economists distinguish between normal and inferior goods
Q172: The value of the cross-price elasticity of
Q188: Luxury goods are
A)price inelastic
B)income inelastic
C)income elastic
D)goods with
Q190: If the income elasticity of demand for
Unlock this Answer For Free Now!
View this answer and more for free by performing one of the following actions

Scan the QR code to install the App and get 2 free unlocks

Unlock quizzes for free by uploading documents