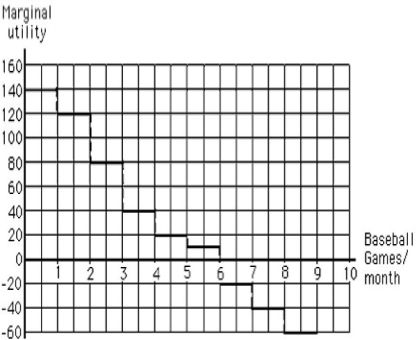
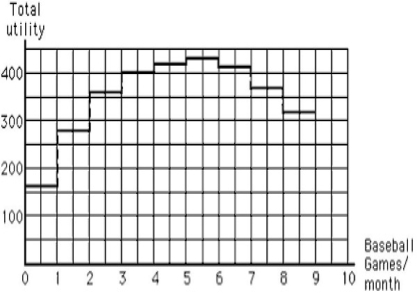
The following graph shows the marginal utility derived by a consumer from watching an additional baseball game every month. Which of the following is true of the total and marginal utilities derived from watching the baseball games?
Figure 6.2
A) For all the ten games, total utility decreases as marginal utility decreases.
B) For all the ten games, total utility increases as marginal utility increases.
C) For the last four games, both total and marginal utility increases.
D) For the first six games, total utility increases as marginal utility decreases.
E) For the first six games, total utility decreases as marginal utility increases.
Correct Answer:
Verified
Q62: Suppose Jason's marginal utility of the $50-per-serving
Q63: Mark's marginal utility of a third waffle
Q64: Suppose Sally allocates her budget between two
Q67: If Dalene's marginal benefit from consuming another
Q68: A consumer's utility is maximized when the
Q69: As long as scarcity exists, _.
A)product prices
Q70: As a consumer allocates income between good
Q72: If Jennie spends her income on ice
Q79: Suppose Annie allocates her income between calzones
Q82: Fernando allocates his lunch money between pizza
Unlock this Answer For Free Now!
View this answer and more for free by performing one of the following actions

Scan the QR code to install the App and get 2 free unlocks

Unlock quizzes for free by uploading documents