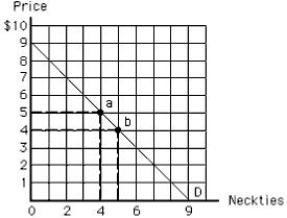
The following diagram shows Ken's demand curve for neckties. When the price of neckties is $5, Ken purchases four neckties. When the price of neckties falls to $4, he purchases five neckties. A decline in the price of neckties causes his expenditure to:
Figure 6.3
A) increase from $20 to $25, increasing his consumer surplus.
B) increase from $20 to $25, decreasing his consumer surplus.
C) remain constant at $20, leaving his consumer surplus unchanged.
D) remain constant at $20, increasing his consumer surplus.
E) decrease from $20 to $15, increasing his consumer surplus.
Correct Answer:
Verified
Q92: If the price of a good increases
Q98: Along a consumer's demand curve the:
A)price of
Q99: If the amount paid for a good
Q100: The following table indicates Sharona's marginal utilities
Q101: Consumer surplus is:
A)the amount by which quantity
Q103: The following diagram shows the demand curve
Q105: As price falls along the demand curve
Q106: The following diagram shows a consumer's demand
Q107: The following diagram shows the demand curve
Q144: The difference between the maximum amount a
Unlock this Answer For Free Now!
View this answer and more for free by performing one of the following actions

Scan the QR code to install the App and get 2 free unlocks

Unlock quizzes for free by uploading documents