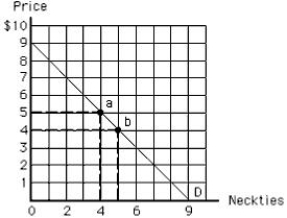
The following diagram shows Ken's demand curve for neckties. Point a on the curve shows that when the price of neckties is $5, Ken purchases four neckties. Point b on the curve shows that when the price of neckties falls to $4, he purchases five neckties. At point b, the dollar value of the total utility is valued at:
Figure 6.3
A) $30.
B) $26.
C) $20.
D) $35.
E) $25.
Correct Answer:
Verified
Q105: A decrease in price along the elastic
Q108: Suppose Debbie is willing to pay $50
Q110: The following diagram shows a market equilibrium.
Q111: The following image shows the demand curve
Q112: Jerry consumes three hamburgers at McDonald's. He
Q112: As price falls along the demand curve
Q114: Elvis values the first gravy sandwich at
Q116: The following diagram shows the market demand
Q117: Suppose Hannah spends $3 to buy five
Q134: Which of the following is true when
Unlock this Answer For Free Now!
View this answer and more for free by performing one of the following actions

Scan the QR code to install the App and get 2 free unlocks

Unlock quizzes for free by uploading documents