Figure 7.1 shows the U-shaped cost curves for a producer. In the table figure, A is the marginal cost curve, B is the average variable cost curve, and C is the average total cost curve. At an output of 10, the:
Figure 7.1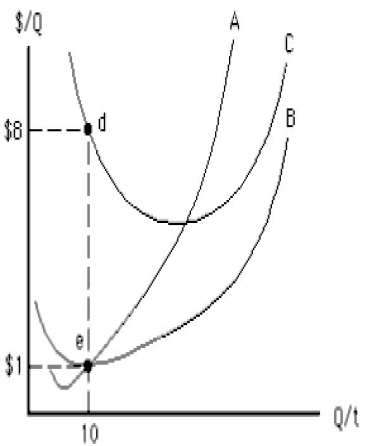
A) total cost equals $10.
B) fixed cost equals $1.
C) variable cost equals $10.
D) marginal cost equals $10.
E) fixed cost equals $10.
Correct Answer:
Verified
Q102: As output rises, marginal product eventually diminishes
Q108: Which of the following correctly describes the
Q109: Figure 7.1 shows the U-shaped cost curves
Q113: If variable cost at each output level
Q115: When a firm is experiencing diminishing marginal
Q116: Total fixed cost divided by the level
Q123: A firm enters into a consent decree
Q130: If a firm shuts down in the
Q134: Total cost is calculated as
A)FC + MC
B)FC
Q158: The average total cost curve and the
Unlock this Answer For Free Now!
View this answer and more for free by performing one of the following actions

Scan the QR code to install the App and get 2 free unlocks

Unlock quizzes for free by uploading documents