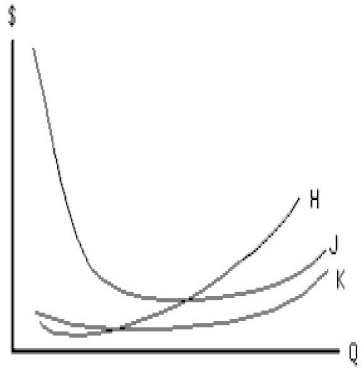
Figure 7.3 shows the short-run cost curves for a producer. In the figure below, lines H, J, and K represent:
Figure 7.3
A) marginal product, average product, and total product, respectively.
B) average fixed cost, average total cost, and average variable cost, respectively.
C) marginal cost, average total cost, and average variable cost, respectively.
D) average total cost, marginal cost, and average variable cost, respectively.
E) marginal cost, average product, average total cost, respectively.
Correct Answer:
Verified
Q129: Which economic concept explains why a large
Q132: To achieve the minimum efficient scale in
Q135: The shape of the long-run average cost
Q136: Which of the following is true of
Q149: Which of the following is true of
Q165: Economies of scale can be caused by
Q171: Empirical studies of production suggest that the
Q172: The minimum efficient scale for a firm
Q173: Economies of scale occur where
A)long-run average cost
Q175: A firm's long-run average cost curve is
Unlock this Answer For Free Now!
View this answer and more for free by performing one of the following actions

Scan the QR code to install the App and get 2 free unlocks

Unlock quizzes for free by uploading documents