Consider the following figure that shows a competitive firm on the left panel and a competitive market on the right panel. The movement along the curve S from point E to E' in the right panel of the figure represents:
Figure 8.8
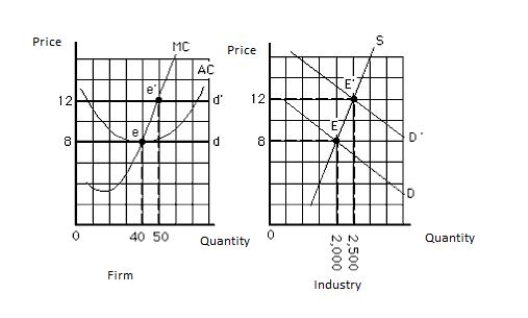
A) an increase in the number of firms in the industry.
B) an increase in output supplied by each firm in the industry.
C) both an increase in the number of firms in the industry and an increase in each firm's output.
D) an increase in the cost of production for the firms in the market.
E) an increase in total revenue of the representative firm from $8 to $12.
Correct Answer:
Verified
Q96: If price is less than minimum average
Q101: Suppose a perfectly competitive firm and industry
Q106: Suppose a perfectly competitive firm and industry
Q109: Consider the following figure that shows a
Q110: A perfectly competitive firm's short-run supply curve
Q116: The price that represents the shutdown point
Q123: A decline in market demand in a
Q130: Suppose an increase in population increases the
Q135: Which of the following factors ensures that
Q140: When an industry supply curve shifts rightward
Unlock this Answer For Free Now!
View this answer and more for free by performing one of the following actions

Scan the QR code to install the App and get 2 free unlocks

Unlock quizzes for free by uploading documents