The figure below shows the cost and revenue curves for a non-discriminating monopolist. The total cost incurred by the monopolist at the profit-maximizing output is _____.
Figure 9.1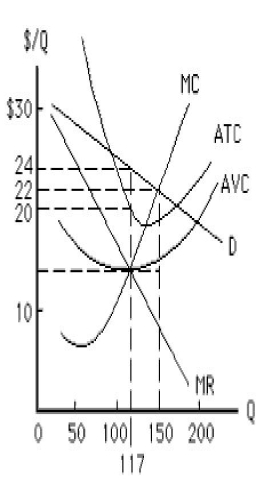
A) $3,300
B) $3,400
C) $2,808
D) $2,340
E) $1,638
Correct Answer:
Verified
Q26: The demand curve facing a non-discriminating monopolist
Q33: A monopolist can either sell 100 units
Q45: Which of the following can be concluded
Q46: The figure below shows a non-discriminating monopolist.
Q47: A monopolist must choose between two points
Q48: Suppose the marginal revenue for a particular
Q52: The loss-minimizing output for a non-discriminating monopolist
Q53: The revenue-maximizing output for a non-discriminating monopolist
Q55: For a monopolist producing a level of
Q56: Which of the following is true for
Unlock this Answer For Free Now!
View this answer and more for free by performing one of the following actions

Scan the QR code to install the App and get 2 free unlocks

Unlock quizzes for free by uploading documents