The figure below shows the cost and revenue curves for a non-discriminating monopolist. The total revenue earned by the profit-maximizing monopolist at the profit-maximizing output is:
Figure 9.2
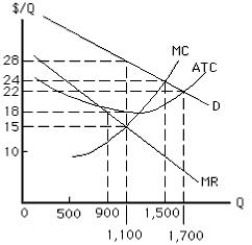
A) $16,200.
B) $36,000.
C) $39,600.
D) $30,800.
E) $31,000.
Correct Answer:
Verified
Q58: A profit-maximizing monopolist supplies the quantity at
Q63: A non-discriminating monopolist observes that marginal revenue
Q66: The figure below shows the cost and
Q72: Which of the following is true of
Q73: Which of the following does a monopoly
Q74: Which of the following conditions is true
Q74: A non-price discriminating monopolist's demand curve:
A)is horizontal
Q75: The figure below shows the cost and
Q79: The profit-maximizing quantity for a monopolist that
Q236: For a monopolist that does not price
Unlock this Answer For Free Now!
View this answer and more for free by performing one of the following actions

Scan the QR code to install the App and get 2 free unlocks

Unlock quizzes for free by uploading documents