The figure below shows the cost and revenue curves for a monopolist. The output level that maximizes profit for the non-price discriminating monopolist is _____.
Figure 9.6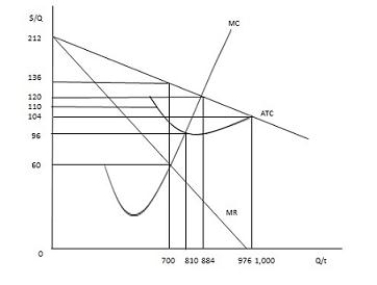
A) 700 units
B) 810 units
C) 884 units
D) 976 units
E) 1,000 units
Correct Answer:
Verified
Q89: If the marginal cost of production for
Q91: The figure below shows the cost and
Q93: The figure below shows the total cost
Q94: The figure below shows the cost and
Q95: The figure below shows the total cost
Q97: Gilligan runs the only dry-cleaning business on
Q98: The figure below shows the cost and
Q99: The figure below shows the cost and
Q100: The figure below shows the cost and
Q101: If the marginal cost curve shifts upward,a
Unlock this Answer For Free Now!
View this answer and more for free by performing one of the following actions

Scan the QR code to install the App and get 2 free unlocks

Unlock quizzes for free by uploading documents