The figure below shows the cost and revenue curves for a monopolist. The output level that is most likely to achieve allocative efficiency in this market is _____.
Figure 9.6
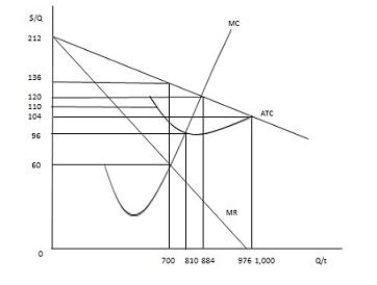
A) 700 units
B) 810 units
C) 884 units
D) 976 units
E) 1,000 units
Correct Answer:
Verified
Q101: If the marginal cost curve shifts upward,a
Q104: The figure below shows the cost and
Q105: Which of the following would distinguish a
Q107: Which of the following is true for
Q109: If a monopolist that does not practice
Q109: A monopolist is likely to overcome a
Q110: Barriers to entry:
A)cause monopolies to experience diseconomies
Q115: Which of the following is most likely
Q116: When compared to firms in perfect competition,monopolists
Q120: Which of the following is true when
Unlock this Answer For Free Now!
View this answer and more for free by performing one of the following actions

Scan the QR code to install the App and get 2 free unlocks

Unlock quizzes for free by uploading documents