The figure given below depicts the cost and revenue curves facing a profit-maximizing monopolist that does not discriminate among its customers. Given the figure, which of the following is true?
Figure 9.9
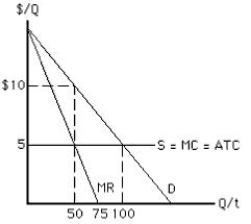
A) An output of 50 units is allocatively efficient, but the monopolist is likely to produce 100 units.
B) An output of 50 units is allocatively efficient, but the monopolist is likely to produce 75 units.
C) An output of 75 units is allocatively efficient, but the monopolist is likely to produce 100 units.
D) An output of 100 units is allocatively efficient, but the monopolist is likely to produce 50 units.
E) An output of 100 units is allocatively efficient, but the monopolist is likely to produce 75 units.
Correct Answer:
Verified
Q134: The figure below shows the cost and
Q135: The figure below shows the cost and
Q138: If the government breaks up a monopoly
Q140: The figure given below depicts a monopoly
Q141: For which of the following products would
Q142: The actual deadweight loss from monopoly in
Q142: A monopolist that engages in perfect price
Q147: A major fruit juice manufacturer fails in
Q167: Which of the following is observed when
Q172: When a monopolist practices perfect price discrimination,_
A)the
Unlock this Answer For Free Now!
View this answer and more for free by performing one of the following actions

Scan the QR code to install the App and get 2 free unlocks

Unlock quizzes for free by uploading documents