The figure below shows the cost and revenue curves faced by a profit-maximizing monopolist. Which of the following areas shown in the figure given below represents consumer surplus under monopoly?
Figure 9.10
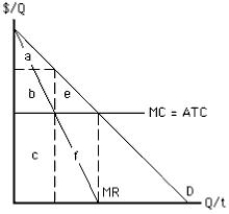
A) Area a
B) Area b
C) Area c
D) Area f
E) Area e
Correct Answer:
Verified
Q102: In the short run,a monopolist will always
Q111: Unlike perfectly competitive firms,monopolists _
A)earn positive short-run
Q118: Which of these is a key difference
Q124: The figure below shows the cost and
Q125: If a perfectly competitive industry is monopolized,
Q127: Which of these is a similarity between
Q128: The true deadweight loss created by a
Q139: Perfectly competitive firms and monopolistic firms determine
Q150: A monopolist practices price discrimination by _
A)charging
Q159: Which of the following is true for
Unlock this Answer For Free Now!
View this answer and more for free by performing one of the following actions

Scan the QR code to install the App and get 2 free unlocks

Unlock quizzes for free by uploading documents